
How Should We Evaluate Higher Education Institutions?
A data science lens on accountability and value

A new federal law—the Opportunity to Borrow, Build, and Benefit Act (OBBBA)—will soon take effect, reshaping how colleges are held accountable for student outcomes. At its core is a single measure: the earnings premium, or whether graduates of a program earn more than peers in their state or nationwide with only a high school diploma. Programs that consistently fail this test risk losing eligibility for federal financial aid under Title IV. While the law’s intent is to protect students and ensure public funds support programs with real economic value, relying on earnings premium as the sole metric raises important questions about fairness, accuracy, and the broader purpose of higher education.
Education analyst Phil Hill has highlighted several flaws in this approach. He notes that the earnings premium metric, while simple, overlooks key factors such as geographic variation, gender differences, and the timing of the data itself. In fact, the official program-level earnings data used to estimate potential failures under OBBBA rely on an outdated, outlier cohort, making projections highly uncertain. These blind spots mean that the law may understate the number of programs at risk and obscure important dimensions of student outcomes.
Asking a Bigger Question
Let’s stand back and ask a bigger question:
How should we evaluate higher education institutions, and which metrics truly matter?
To help answer this, I will soon be launching a website for researchers and policy makers that takes a broader view. My approach is to use the lens of data science—bringing together multiple metrics, visualizations, and analyses to provide a richer picture of college value. One of the first tools on this site is the College Value Grid, a visualization designed to highlight the relationship between cost and graduation rates, and to open a broader conversation about accountability.
The College Value Grid
The College Value Grid (below) provides a simple but powerful way to visualize the relationship between college cost and graduation outcomes. By plotting institutions on two axes—cost (tuition and fees) and graduation rate—we can group them into four quadrants that each tell a different story about value:
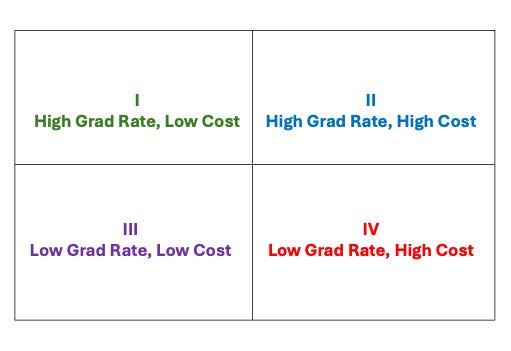
Quadrant I (Top Left): High Graduation Rate, Low Cost
These are the clear success stories. Institutions here deliver strong student outcomes without imposing a heavy financial burden. They represent the highest value in the system.
Quadrant II (Top Right): High Graduation Rate, High Cost
These schools also graduate students at high rates but at a significant expense. They may still offer value—particularly if earnings justify the investment—but they raise important questions about affordability and accessibility.
Quadrant III (Bottom Left): Low Graduation Rate, Low Cost
Institutions here minimize financial risk but struggle to get students across the finish line. For some students, the low cost might offset the lower odds of completion, but overall these programs raise concerns about effectiveness.
Quadrant IV (Bottom Right): Low Graduation Rate, High Cost
This is the most troubling quadrant. Students pay a premium yet face poor odds of graduating, creating the highest risk of debt without a degree. Programs concentrated here deserve the greatest scrutiny from both policymakers and the public.
A Look at the Data
The figure above shows all U.S. four-year higher education institutions with enrollments over 1,000, plotted by cost (in-state tuition and fees) and graduation rate. A striking pattern emerges. Quadrant I—high graduation rates at low cost—is dominated almost entirely by public institutions (green), underscoring the value they deliver. By contrast, a significant number of schools fall into Quadrant IV—the high-risk zone of high cost and low graduation rates—where students face the greatest danger of leaving with debt but no degree. Equally noteworthy is the comparison between Quadrants I and II: public institutions in Quadrant I are delivering graduation outcomes comparable to those in Quadrant II, but often at just one-third or one-quarter of the cost. This makes plain the affordability advantage of the public sector and highlights where accountability concerns should be most sharply focused.
When it comes to accountability, there’s value in starting with simple, intuitive metrics—a version of Occam’s razor applied to higher education. Cost and graduation rate are both straightforward to understand and immediately relevant to students, families, and policymakers. But simplicity should not come at the expense of breadth. A single measure like the earnings premium can obscure as much as it reveals. By looking at multiple metrics side by side, we gain a richer, more balanced picture of institutional performance and can better distinguish between programs that are affordable and effective, those that are overpriced, and those that may warrant closer scrutiny.
Conclusion
The coming federal rules will focus narrowly on the earnings premium as the single yardstick of value. That approach may have the virtue of clarity, but it also risks reducing a complex landscape to a single dimension. The website I am developing will take a broader perspective, offering multiple metrics and analyses to make the trade-offs in higher education more visible. The College Value Grid is just one small example of this effort—a simple visualization of cost and graduation outcomes that illustrates how even basic metrics can reveal important patterns. By layering in additional measures such as debt, earnings, and equity, the goal is to create a framework that is both accessible and comprehensive, giving researchers and policymakers better tools to evaluate institutional performance.
Stay tuned for the launch of the website, where I’ll share more tools, visualizations, and data-driven analyses designed to move the accountability conversation forward.